Yes — we have seen parts of this market before, but not the exact combination. The closest historical journey is a blend of the 1970s inflation-driven housing boom and the 2005–2007 credit-fueled bubble, while today’s market is more of an affordability squeeze than a pre-crash credit boom.
The historical journey
The U.S. housing market tends to move in long cycles, with major booms and busts showing up repeatedly over the last two centuries. One historical overview argues that land and real-estate cycles have often peaked roughly every 18 years, with major turning points in periods like 1837, 1873, 1893, 1929, 1974, and the early 2000s.
Closest match: 2005–2007
The most obvious parallel is the mid-2000s housing boom. House prices rose rapidly from 1998 to 2006, and the European Central Bank’s historical analysis describes that stretch as unusually “hot,” with the probability of a hot housing state peaking around 2005–2006.
That era evolved in a familiar sequence:
-
Prices accelerated.
-
Credit loosened.
-
Speculation increased.
-
Delinquencies rose.
-
The market broke and fed into the financial crisis.

Earlier echo: the 1970s
The 1970s were different in cause but similar in feel. Inflation made real estate attractive, but rising rates later crushed affordability and slowed construction.
That period matters because it looks a lot like today in one important way: housing became expensive relative to incomes, and higher borrowing costs made buyers more cautious.
What changed this time
Today’s market is not a repeat of 2008 because the main pressure is not widespread subprime risk. Recent 2026 market commentary points instead to a supply-constrained market with elevated mortgage rates, slow price growth, and improving but still tight affordability.
That means the current phase is more like:
-
High prices without equal income growth.
-
Elevated rates keeping transactions muted.
-
Low inventory limiting downside.
-
More stalemate than collapse.
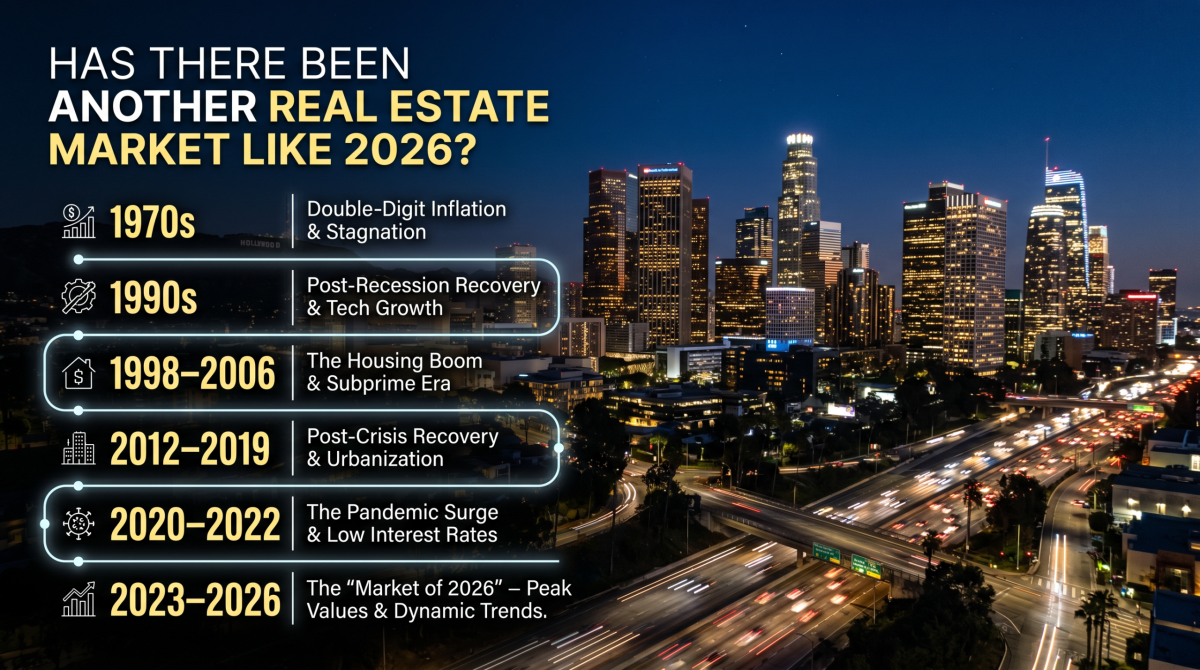
Simple timeline
-
1970s: inflation-led boom, then affordability crisis.
-
1990s: relatively quieter, slower growth.
-
1998–2006: major surge, ending in the 2008 crash.
-
2012–2019: recovery and normalization after the crash.
-
2020–2022: pandemic-era demand shock and rapid price acceleration.
-
2023–2026: affordability squeeze, low supply, and slower growth.
The best historical answer is: yes, but only in pieces — today most resembles a mix of the 1970s affordability stress and the early-2000s price run-up, without fully matching the credit fragility of 2008.
“Helping you buy the right home in Calabasas — not just any home.”

FRANCESCA LUTERAAN
818-618-9368
Rodeo Realty
23901 Calabasas Rd.
Calabasas, CA 91302
www.FrancescaLuteraan.com
https://linktr.ee/luteraan
DRE #01115331
Leave a Reply